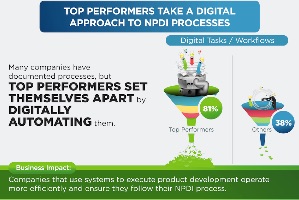

This infographic shares our research on how Top Performing companies achieve better NPDI performance than their competitors, excelling at revenue growth, margin expansion, and delivering innovative products. The infographic starts by providing a graphical view of the unfortunate truth about new product development, companies miss their quality, cost, requirements, regulatory compliance, project budget, and time to market targets far too often. The graphic shares perspectives from our research.
The piece is an Autodesk infographic leveraging data from our 7 Ways to Outperform Your Competitors in NPD research.

This does not provide any information about what type of product or product complexity is involved in the product being developed. It does not provide information about the industry the product is going into, the size of the company, the number of people involved in the project or budget for the project. The last thing missing is actual time to market for the top performers and the others.
Ed, you are correct. This is a generalization across industries, company sizes, and product types. The research was limited, however, to manufactured products so it does not include products such as financial services, etc. that also go through a NPDI process.
We chose to focus on performance relative to competitors, as opposed to specific values for metrics like time to market, for that exact reason. As you can imagine, a time to market averaged across all of the factors you mention would be pretty much meaningless!
Thanks for the feedback, we have more data than we can publish in a format like this (breakdowns by industry, etc.).
Hi Jim, I find this Infographic very much useful to understand the benefits of moving towards digitalization and the impact to NPDI. No matter the type of manufacturing company, products and procesess, the competitors are struggling to win the time to market battle. Of course, keeping standards and high quality at the highest level. (@Jhidarey).
Thank you Javier,
I couldn’t agree more. In our research, we often see that quality, reliability, and performance are the drivers for product success and profitability. But in many cases, those are simply expected in the market and the differentiation comes from agility and innovation – getting an exciting product to the market quickly.
Thanks for your comment!
Best,
Jim
PS – I tried to connect with you on LinkedIn but needed your email, let’s stay in touch
You stress time to market, but I’d like to check about being ‘right to market’ more than being fast, with other competitors copiying and outperforming your initial innovation
Thank you Jose,
The study showed that companies that were achieving higher levels of NPDI performance placed more emphasis than others on time to market. That’s just one factor they focus on, it just happened to be a differentiating one. Getting the wrong product to market fast is probably not a good path to success, and certainly not to sustainable, profitable growth!
Thanks for commenting,
Jim