Tech-Clarity

Making the value of technology clear

  • Published Research
    • eBooks
    • White Papers
    • Survey Results
    • Buyer’s Guides
    • Infographics
  • Research Invitations
    • Survey Invitations
    • Assessments
  • Presentations & Videos
    • Webinars
    • Live Presentations
    • Tech-Clarity TV
    • Virtual Events
  • Insights & Activity
    • In the News
    • Insights
  • About
    • Team Tech-Clarity
    • Jim Brown
    • Michelle Boucher
    • Julie Fraser
    • Rick Franzosa
    • Arvind Krishnan
  • Search
  • Search
  • Date

Infographics

Cloud Value Infographic Thumb

Escalating Cloud Value by Adoption & Maturity (infographic)

How do companies achieve cloud value from product innovation and engineering software? How does that value expand with greater adoption and maturity? This infographic shares the benefits that companies achieve from the cloud from implementation, operation, and business perspectives. It goes beyond these to share how even greater ROI is available from strategic benefits and…

Read More →

  • Infographics

Jim Brown - November 18, 2019 - Filed Under: Published Research, Infographics - Tagged With: Adoption, Strategy, Maturity, Infographic, PLM, Cloud Value, CAD, Cloud ROI, Security, Siemens, Engineering Software, Product Innovation

Empowering Design Engineers

How can you empower design engineers to make more informed decisions that can help set your products apart from the competition? Tech-Clarity’s Empowering Design Engineer infographic helps answer this question based on a survey of 195 companies. The infographic reveals top qualities that will make products more competitive over the next five years. These product…

Read More →

  • Infographics

Michelle Boucher - May 21, 2019 - Filed Under: Infographics, Published Research - Tagged With: Engineering Decisions, Research, PTC, Design, CAE, Simulation, Analysis, Simulation Driven Design, Infographic, Design Engineers

How Digital Chemical Labs Drive Innovation (infographic)

How do Top Performers in the chemical industry leverage digitalization in the chemical lab to overcome their innovation struggles? A Tech-Clarity survey shows that chemical companies face a myriad of innovation-related challenges including cost pressure, sustainability, more customer-driven products, and specialized / performance materials. This infographic provides a graphical snapshot of the research sharing that…

Read More →

  • Infographics

Jim Brown - August 27, 2018 - Filed Under: Infographics, Published Research - Tagged With: Challenges, Maturity, Top Performers, Infographic, Digitalization, Digital, Chemical Lab, Chemical Industry, Chemical, Survey, Time to Market

How to Beat Your Competition in Product Development (infographic)

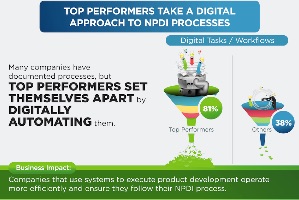
This infographic shares our research on how Top Performing companies achieve better NPDI performance than their competitors, excelling at revenue growth, margin expansion, and delivering innovative products. The infographic starts by providing a graphical view of the unfortunate truth about new product development, companies miss their quality, cost, requirements, regulatory compliance, project budget, and time…

Read More →

  • Infographics

Jim Brown - October 31, 2017 - Filed Under: Published Research, Infographics - Tagged With: Best Practices, Systems, Benchmark, Budget, Compliance, Infographic, Product Development, NPDI, New Product Development, Targets, NPD, Quality, Time to Market, Cost

Choosing Cost versus Quality in CPG (infographic)

This infographic shares survey results about quality and cost management in the Consumer Packaged Goods industry. It visually communicates the results of our research that shows how Top Performing CPG companies are able to achieve better quality and better cost of quality, without trading one for the other. The research shares the methods these leading…

Read More →

  • Infographics

Jim Brown - September 28, 2017 - Filed Under: Published Research, Infographics - Tagged With: Lab Software, Survey, Quality Management Quality, QMS, Quality, Integration, Cost, CPG, Consumer Packaged Goods, Infographic, LIMS, TQM, Research

The CPG Digital Thread (infographic)

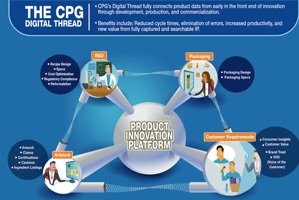
This infographic shares the importance of developing a cohesive digital thread when developing formulated products in the consumer packaged goods industry. The digital thread should be driven by customer requirements and incorporate the recipe / formulation, specifications, packaging design, compliance information, claims, cautions, ingredients, labeling, artwork, and more to provide a full view of the product…

Read More →

  • Infographics

Jim Brown - June 13, 2017 - Filed Under: Published Research, Infographics - Tagged With: Artwork, Recipe Management, Formula Management, Product Development, Digital Thread, NPD, Product Innovation Platform, Recipe, Labeling, Formulation, Commercialization, CPG, Customer Requirements, Consumer Packaged Goods, Infographic, Packaging

  • « Previous Page
  • 1
  • 2
  • 3
  • 4
  • Next Page »
Join our community to receive our newsletter and survey invitations.

Copyright © 2012-2024 – Tech-Clarity, Inc.

  • Contact
  • Privacy Policy
  • Date

  • LinkedIn
  • Facebook
  • LinkedIn
  • Facebook

Copyright © 2012-2024 – Tech-Clarity, Inc.