Tech-Clarity

Making the value of technology clear

  • Published Research
    • eBooks
    • White Papers
    • Survey Results
    • Buyer’s Guides
    • Infographics
  • Research Invitations
    • Survey Invitations
    • Assessments
  • Presentations & Videos
    • Webinars
    • Live Presentations
    • Tech-Clarity TV
    • Virtual Events
  • Insights & Activity
    • In the News
    • Insights
    • Expert Interviews
  • About
    • Team Tech-Clarity
    • Jim Brown
    • Michelle Boucher
    • Julie Fraser
    • Rick Franzosa
    • Howie Markson
    • Arvind Krishnan
  • Search
  • Search
  • Date

Infographics

Clear Concise Safe Service

Navigate the Service Maze with Clear, Concise, and Safe Practices

As highlighted in a McKinsey report, “From Field to Remote Operations: Embracing Change to Enable Growth,” maximizing the efficiency of field service technicians is becoming increasingly crucial for organizations, especially as they face the retirement of their experienced field service technicians. Field service technicians also act as ambassadors for their company and directly impact their…

Read More →

  • Infographics

Arvind Krishnan - February 5, 2025 - Filed Under: Infographics, Published Research - Tagged With: Service Productivity, Service Lifecycle Management, Overall Equipment Effectiveness, First Time Fix, SLM, Servitization, Service, Service Instructions, Service Documentation, TCO, Safety, Design for Service, Field Service, Serviceability, Remote Monitoring, Service Efficiency, OEE, Customer Satisfaction

Service Driven Design

Win the Service Challenge Game with Service Driven Design

A McKinsey publication shows that the average EBIT margins for after-market services are 150% higher than those for selling new machines. As revenue from services becomes increasingly important to manufacturers, it is vital that leaders pay attention to harnessing the full benefits of servitization by embracing “Service Driven Design.”  How can manufacturers adopt an effective…

Read More →

  • Infographics

Arvind Krishnan - January 29, 2025 - Filed Under: Published Research, Infographics - Tagged With: Service Transformation, Remote Monitoring, Servitization, Service Lifecycle Management, SLM, Service Driven Design, Service Documentation, Design for Service, TCO, Serviceability

Non-value-added time in CAD Design

The Game of Avoiding Wasted Time in CAD Design

Our research shows that engineers spend a significant percentage of their time, almost a day a week, on non-value-added data management activities such as finding information, working with the wrong data, recreating data, translating formats, and other common time wasting tasks. These time wasters cause them to miss deadlines, develop products with higher costs, miss…

Read More →

  • Infographics

Jim Brown - November 19, 2024 - Filed Under: Infographics, Published Research - Tagged With: Multi-CAD, Efficiency, Design Data Management, Benefits, CAD Data Management, NVA, CAD Management, PLM, Search, Time Wasters, PDM, Wasted Time, Collaboration, Inefficiency, Product Lifecycle Management, Non-Value-Added Time

Remote Monitoring

Improve Service with Equipment Monitoring

How can companies leverage the IoT to increase service profitability and customer loyalty? Many companies have found that remote monitoring helps them transform service to dramatically improve service performance. But what’s required to turn machine data into actionable service intelligence?  This infographic highlights the key findings from our buyer’s guide on improving service with remote…

Read More →

  • Infographics

Jim Brown - December 13, 2022 - Filed Under: Slideshow, Published Research, Infographics - Tagged With: Infographic, IoT, IIoT, Service Transformation, Remote Monitoring, Condition Monitoring

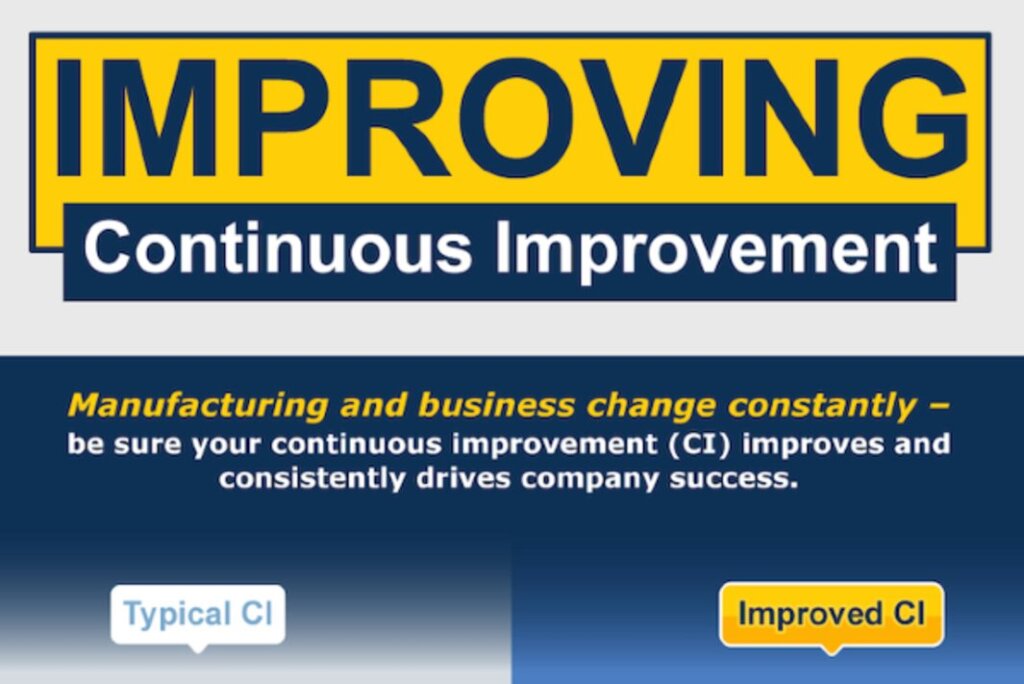
Improving Continuous Improvement

Should you be improving continuous improvement (CI) in your company? For many companies, the answer is yes. Find out the difference between a typical continuous improvement program and one that’s better in this infographic to see whether you have room for improvement on your CI. Data is at the heart of any CI program. Yet…

Read More →

  • Infographics

Julie Fraser - July 26, 2022 - Filed Under: Infographics, Published Research - Tagged With: trust, empowerment, Manufacturing, Business Value, Lean, Data Management, Continuous Improvement, Consistency, cleansing

  • « Previous Page
  • 1
  • 2
  • 3
  • 4
  • 5
  • Next Page »
Join our community to receive our newsletter and survey invitations.
This field is for validation purposes and should be left unchanged.

Copyright © 2012-2025 – Tech-Clarity, Inc.

  • Contact
  • Privacy Policy
  • Date

  • LinkedIn
  • Facebook
  • LinkedIn
  • Facebook

Copyright © 2012-2025 – Tech-Clarity, Inc.

Receive our Latest Research

Subscribe to Tech-Clarity to be notified about new research results and survey opportunities.

Join our community to receive our newsletter and survey invitations.
This field is for validation purposes and should be left unchanged.